Podbean’s User Engagement Intel provides a detailed analysis of listener behavior within the Podbean iPhone App, Android App, Podbean site player and Podbean embed players. The engagement intel includes when and where podcasts are being played (and who is playing, in the case of private podcasts), as well as the length of playing/what portions of the podcast were played.
This feature is available on Podbean's Network Plan and above hosting plans.
Here’s how to locate and use User Engagement Intel.
- To access your engagement statistics, log in to your Podbean account and click on "Channels" on left-hand column. Select your desired podcast channel, and then go to "Statistics" and click on "Engagement."
- User engagement data are reported from the Podbean Pro App, the Podbean Podcast app and the Podbean site to Podbean’s servers. The engagement data is reported to the server side when users play, stop, pause, skip or relisten to portions of your podcasts. It requires an online connection when the engagement data is reported. If the connection is offline at that time, the engagement reporting will fail and this play record will be lost.
- Click on the drop down menu at the top of the page to the right of “Select Episodes”. Select the episode that you’d like to review the analytics for.
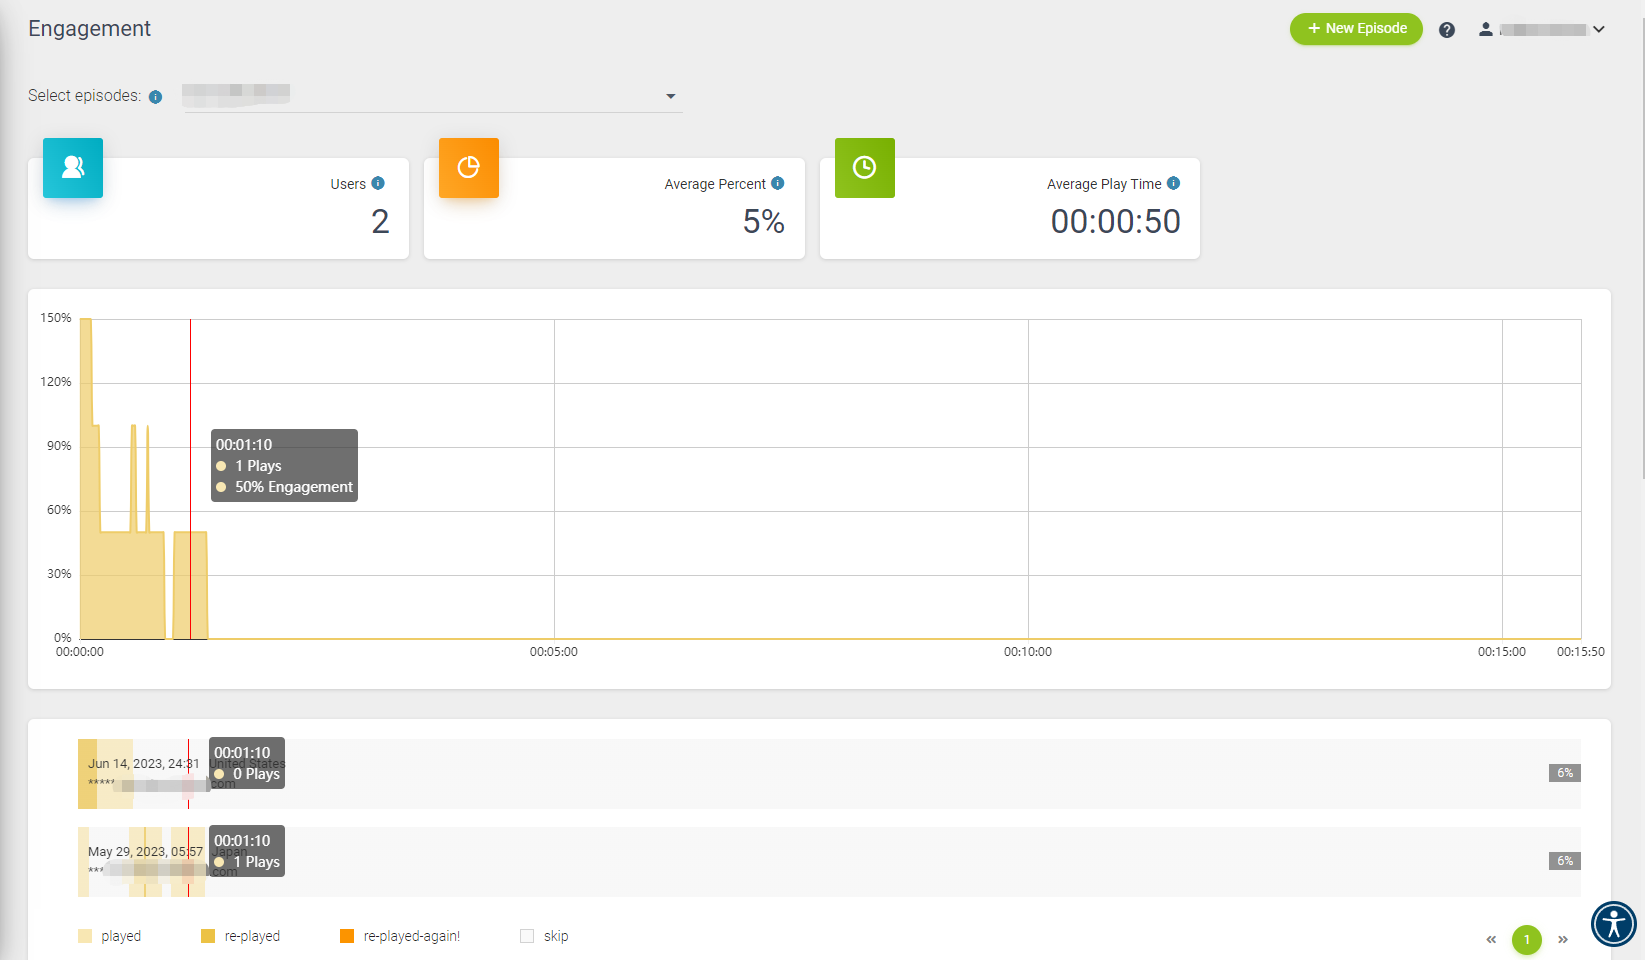
- Your Engagement dashboard will show the number of unique users who listened to the episode, the average engagement percentage across your listeners, the average play time of the episode, and showcases a graph that reflects the engagement of listenership throughout the episode.
- Underneath the graph, you’ll be able to view individual user engagement for each episode. Note that you will only be able to view individual user listenership for private podcasts. However, public podcasts will still be able to view the overall listenership and engagement data for their public facing content using user engagement intel.
- Each graph reflects the device used to listen, the date and time of listenership, and the engagement with the episode.
- White spots are spots that the user did not listen to, light orange shows single listenership of a section, the darker orange shows a second replay of a section, and the darkest orange reflects three + plays of a section.
- You’ll also be able to review the percentage that this user has listened to the episode.
- Each graph reflects the device used to listen, the date and time of listenership, and the engagement with the episode.
- Under the individual user engagement, you will be able to download the monthly engagement raw data as an .csv file.