
Podbean provides episode-level podcast statistics to help you understand how individual episodes perform over time.
This guide explains how to use Episode Performance, Download Trends, and Listener Engagement in your Podbean dashboard to evaluate downloads, compare episodes, and understand audience behavior.
From your Podbean dashboard, go to Statistics -> Episodes to view episode statistics.
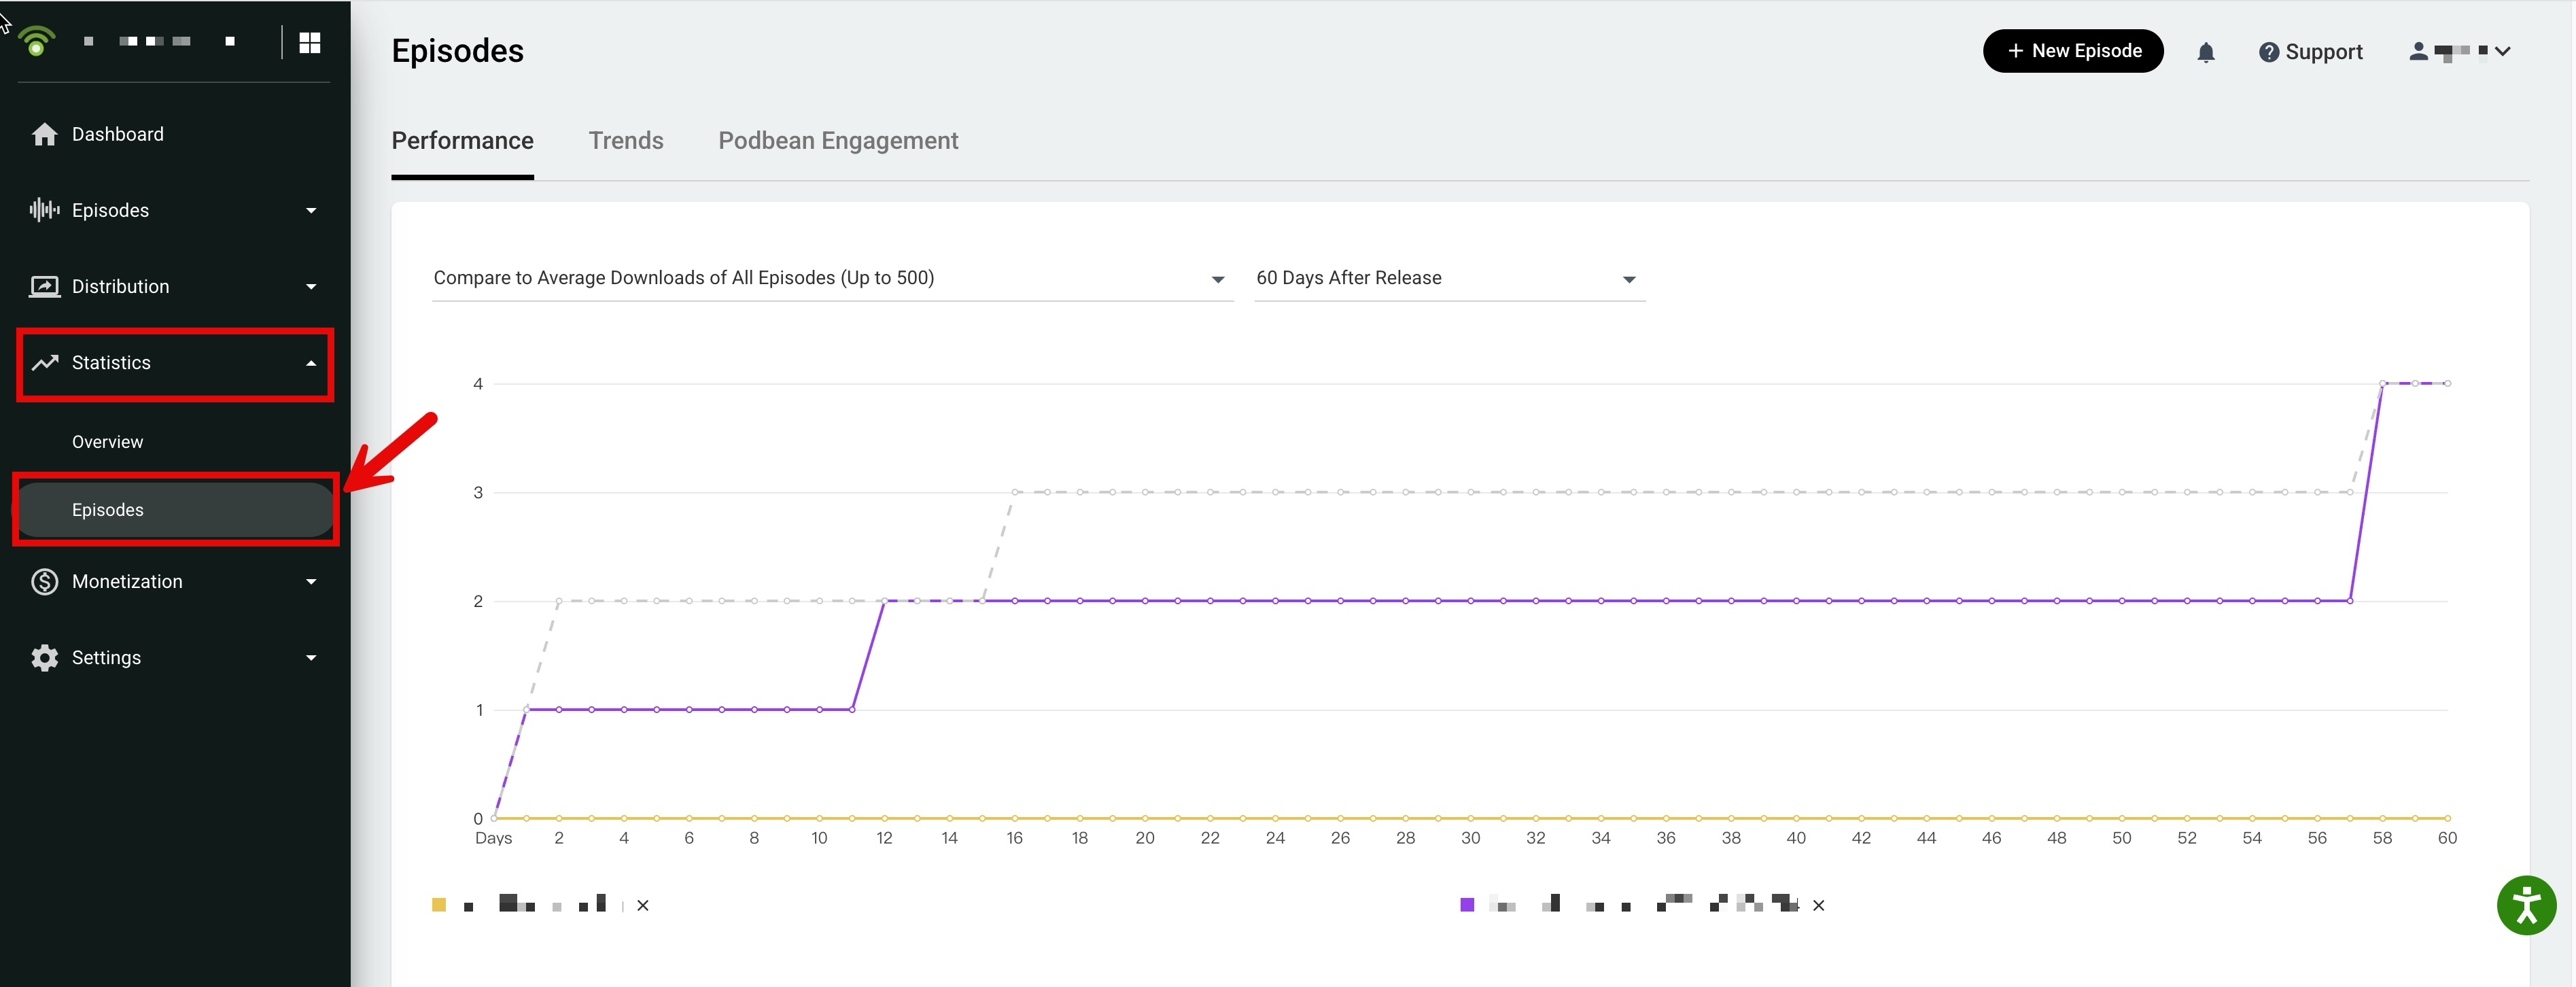
Here is a brief description (click the titles below to get more details):
- Episode Performance - Compares episode performance to the average downloads.
- Download Trends - The downloads for each episode during the selected time period.
- Listener Engagement - Reflects listener interaction with the episodes.
Episode Performance
Episode Performance compares each episode’s downloads with the average downloads of your recent episodes.
You can compare an episode against the average performance of your last 10 episodes, last 50 episodes, or all episodes (up to 500 episodes).
This helps you see whether a new episode is performing above, below, or close to your usual episode performance.
Hover over the chart to view detailed day-by-day comparison statistics.
Note: You can select up to 10 episodes to compare.
Download Trends
Download Trends shows how episode downloads change over time.
You can view download trends for all episodes or for a selected episode.
Trends for “All Episodes”:
- View by Date
View daily downloads of all episodes. Click on the download number to see the breakdown by episode. - View by Episode
See downloads for each episode within the selected time range.

Trends for a Single Episode:
- View by Date
View daily downloads for the selected episode.

Listener Engagement
Listener Engagement helps you understand how listeners interact with your episodes.
- Listeners on Podbean
Listeners who played your podcast through your Podbean podcast website, embedded player, or the Podbean app. - Engaged Listeners
Listeners who played at least 40% of the selected episode. - Average Consumption Rate
The percentage of an episode that listeners listen on average. - Average Consumption Time
The average amount of time listeners spent listening an episode.
Visual engagement charts help you identify where listeners pause, skip, or stop listening. This can help you understand audience retention and improve future episodes. See more details here.
Note: Engagement data will be available within 24 hours after episodes are played. Episodes with no engagement data will not appear in the episode selector.